Allocation and Investment Committee Meeting 11/11/25
I hope this finds everyone well. This is going to be a bit different from what you are accustomed to seeing from me. I feel that it is important to detail for all investors with Redfish Capital what I am seeing and thinking in this current market. Below you will find some charts and thoughts on the current state of the markets and how I am attempting to interpret them. As a note, it is important to remember a couple of things. One, I do not own a crystal ball and cannot at all predict the future. The only thing that I can do is try my best to combine the history of the markets, my over thirty years of experience in these markets, with what I am seeing at this moment. Finally, as most of you know, I tend to be a little more conservative with my recommendations and allocations than others. This is neither right nor wrong. It is just the way I view things and manage money.
Redfish Capital Management, LLC is registered as an investment adviser with the State of Texas and only transacts business in states where it is properly registered or is excluded or exempted from registration requirements. Registration as an investment adviser does not constitute an endorsement of the firm by the SEC, nor does it indicate that the adviser has attained a particular level of skill or ability.
The content presented is developed from sources believed to be accurate and should not be regarded as a complete analysis of the subjects discussed. All expressions of opinion reflect the judgment of the author and are subject to change. The information in this material is not intended as tax or legal advice. A legal or tax professional should be consulted for specific information regarding your individual situation. The material presented is for general informational purposes only and does not constitute the rendering of personalized investment advice. Past performance may not be indicative of future results. All investment strategies have the potential for profit or loss. Different types of investments involve varying degrees of risk, and there can be no assurance that any specific investment or strategy will be suitable or profitable for a client's portfolio. Content should not be construed as an offer to buy or sell, or a solicitation of any offer to buy or sell any of the securities mentioned.
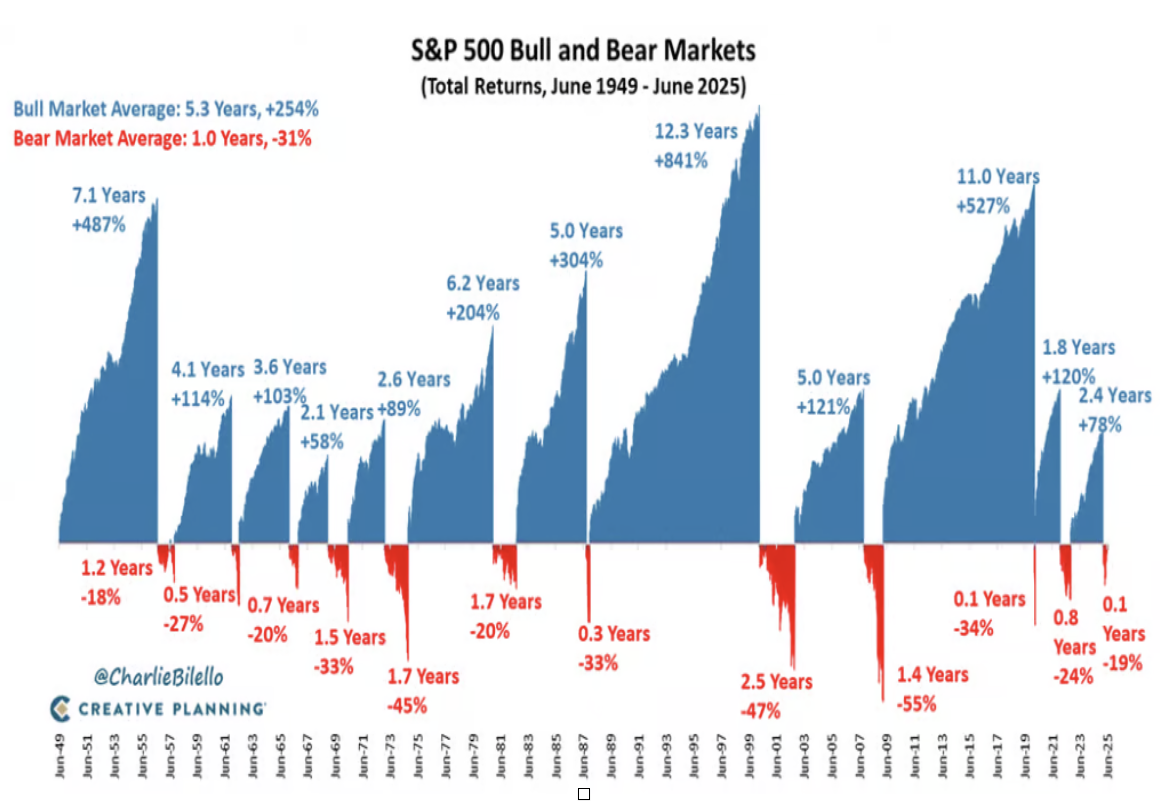
The above chart is outstanding. This was sent to me from Charlie Bilello’s blog that I follow closely. What you see in this chart is the S&P 500 going all the way back to 1949. The point of this chart is to show that the index has a strong history of bull markets interspersed with periods of bear markets. You will note that the bear periods are generally very short lived but have a deep impact on the current time. My younger readers simply should not care about this as the long-term trend is clearly bullish. However, my readers with a shorter investing time frame should heed this chart. Bear markets and corrections happen and will continue to do so. It is important to know that we cannot predict the next one. It is impossible. But we can predict that a correction or bear market will come. The question is when.
As you know, the S&P 500 is the largest and most important stock index we use. It is also the largest investment index people in the US have. So, when this index does well, most investors also do well. It is the gauge that everyone pays attention to.
The S&P 500 is comprised of approximately 500 of the largest U.S. publicly traded companies, selected by a committee at S&P Dow Jones Indices based on criteria including market capitalization, profitability, and liquidity. The index is market-capitalization-weighted, meaning that larger companies have a greater influence on the index's value.
To be considered for inclusion, a company must meet several criteria:
Market Cap: Have a total market capitalization of at least $22.7 billion (as of September 2025). This threshold is periodically reviewed.
Location: Be based in the U.S.
Exchange: Be listed on an eligible U.S. exchange, such as the NYSE or Nasdaq.
Profitability: Have positive earnings over the most recent quarter, as well as over the sum of the four most recent quarters.
Structure: Be a corporation that offers common stock.
Liquidity: Meet certain liquidity requirements, including a float-adjusted liquidity ratio and monthly trading volume.
The S&P 500 includes companies across 11 major sectors of the economy. As of September 2025, the sector breakdown included:
Information Technology (31.6%)
Financials (14.3%)
Consumer Discretionary (10.6%)
Healthcare (9.6%)
Communication Services (9.6%)
Industrials (8.7%)
The idea behind investing in the index is to have exposure or an investment allocation in a broad array of stocks. Now remember that the index is market cap weighted. You own more of company #1 than you do company #500.
As this current bull market has run, the majority of the run has taken place in just a few companies...the top ones in the index. Right now, the top three companies in the index are Nvidia, Microsoft, and Apple. The combination of those three alone make up over 22% of the entire index. Without going into too much detail, the top five companies make up nearly 30% of the index, and the top ten is over 40% of the entire index. This is the highest concentration in history.
Think about it this way. Your intention for investing in the S&P 500 was to be diversified. You invest $500 in the index. If the index was equally weighted (which you can do) you would own $1 in every company in the index. So if one company’s stock got crushed, you would lose on the $1 or .2% of your investment. You can handle that.
However, this is not the case today. Your $500 would be $200 in ten companies and $300 in the remaining 490. Yuck. This is what we refer to as a very narrow market. VERY NARROW.
Quite simply, this makes me nervous. I have had many long conversations with certain investors recently. The longest conversations I have had are with those who are within a few years of their retirement date goal. What we are discussing is their retirement accounts at their employer. Think 401K, 403B, SEP, or thrift plans. Should we have a correction, which is a possibility, they are on the hook to lose at least 20% of their investments IF they are heavily weighted towards growth, and we see a bear market. The reason why this concerns me is that they do not have the time to make that back up should the return to the old highs take a couple of years. I tend to think about my client’s employer sponsored retirement accounts not in terms of assets but of what kind of INCOME this asset needs to generate so that they can live out their retirement lives.
At Redfish Capital, our own Certified Financial Planner Robert Simpton does nothing but build financial plans based on income calculations and projections. He then passes this plan over to Dawn’s team of CPAs and accountants to let us know the taxable consequences at play. We now can give a fairly accurate income projection to the client.
Let’s use some simple math. Investor A has $1,000,000 in their 401K. They are 63 and plan to retire at age 65. I can look at some charts and see that this client would be eligible to retire with today’s $1,000,000 and lock in 7.31% or $73,100 in income every year for the rest of his or her life. Never run out of money, just income. However, if a bear market or 20% correction did occur, when they retire, they now have $800,000. Based on that retirement date of age 65, they would see a 6.85% guaranteed rate of return or $54,800 a year. Simple math shows that there is a difference of $18,300 a year. Now take that figure and multiply that out by the number of years they live (pretend 85 for fun). They “lost” $366,000 cumulatively over their lifetime. That my friends is a lot of money.
I often ask potential clients this question. What would hurt more? If you lost an opportunity to make more money or if you straight up lost that money? For most, it is the loss of money that hurts more. I think that we may be in that place today where investors need to ask themselves why wouldn't take some of these gains off the table at this point in time. What would it hurt? Well, the markets could explode forward and then they would have much more money. This would certainly hurt to watch. “I could have had______!” But I think it would hurt more if the investor actually lost capital and had to make changes in their income projections for the rest of their financial life.